 by
by
Just recently, I bought a used Mac Mini to tip my toes into mobile development. After doing a bit of research, there's mostly three viable options for doing cross-platform mobile development: Either React Native, Cordova or Xamarin. I figured that due to my knowledge in C#, Xamarin would be a nice fit. However, there's way less components and libraries than in the node eco system, which is especially true for charts. There are commercial options available, but I didn't find a free, open source charts library.
But there's help: In Xamarin.Forms, you can easily use a WebView to display, well, web or Html content. It works surprisingly well, and you can even extend it to communicate between your .Net code and JavaScript in the Browser. So I tried it out and threw a bit of a proof-of-concept together:
The Xaml for the page is quite simple. It's just a WebView that's bound to the ReportHtml property of the ViewModel.
Then there's the ViewModel:
It's a bit long, since I've cramped everything in a single file. To summarize:
- Build a valid Html document
- Include Chart.js
- Add your Chart.js configuration
The sample requires some adjusting before you can use it. It's using PropertyChanged.Fody and Dan Siegels great Prism Template Pack, so check these repos out if something isn't clear with the code.
After that, you see this page: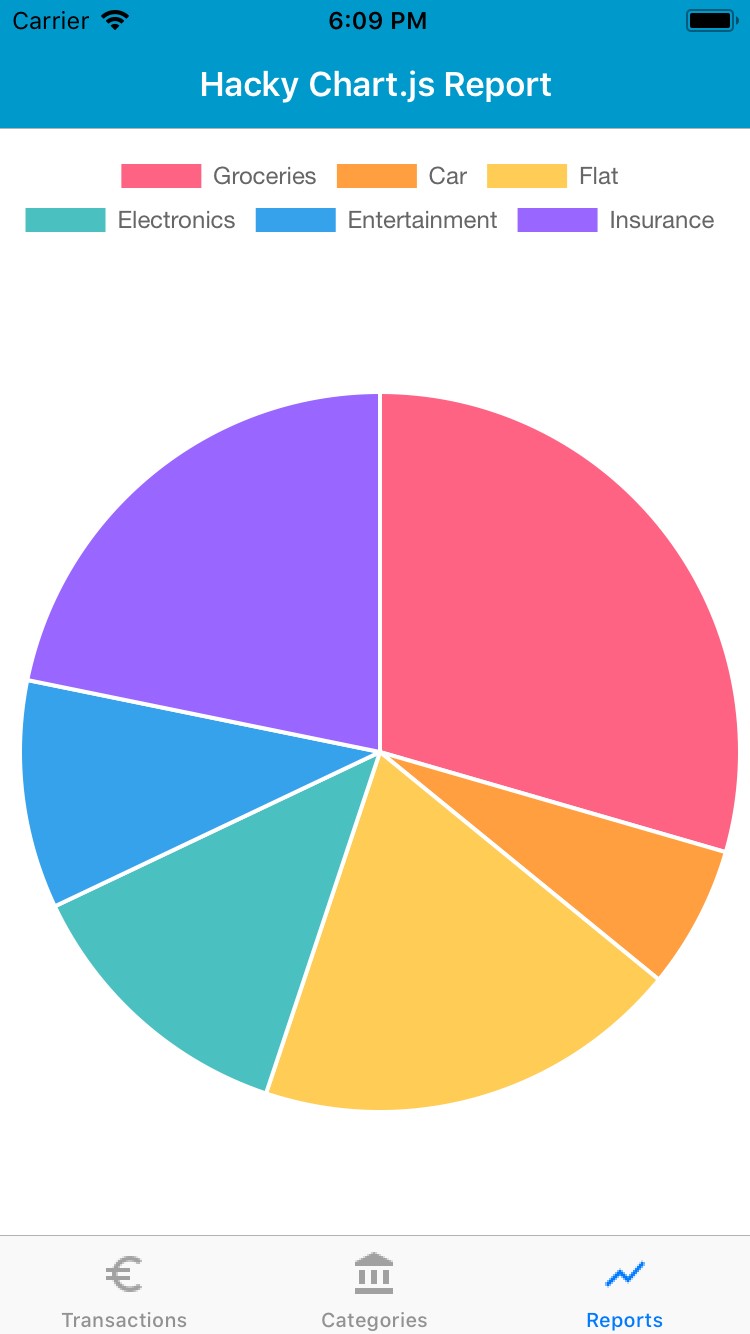
Happy charting!