Profiling your application is important. While optimization is rarely the highest priority, you should at least have an idea of what your computing resources are being spent on. I've found the MiniProfiler, developed by the StackExchange team and extensively used at Stack Overflow, to be a great tool for that.
I love it mostly for two things:
- You get an idea of how long each step of your requests take
- It profiles and analyzes your SQL calls. This is great for finding slow queries and identifying where you have N+1 problems
The server side configuration doesn't differ when you're designing a Single Page Application (SPA), but the (current) client side snippet does not yet support Angular 2, Angular 4 or newer frameworks. Whenever you do a profiled request, MiniProfiler attaches a x-miniprofiler-ids Http header with ids to relate the profiling results. Now your client side code should request them and display them for you, but this doesn't integrate yet in Angular without implementing a custom hook in Angulars Http class.
The MiniProfilerHttp class just extends Angulars Http provider. It's checking every response for profiler ids and, if any are found, requests the results.
You have to alter your applications NgModule to provide the derived class instead of Angulars Http provider.
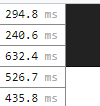
Now, your applications API requests should make MiniProfiler display you the results without having to do a full refresh of the site:

If you've configured the backend correctly and added the MiniProfiler includes to your website, you'll see the results being displayed in the top left of your page.
Happy profiling!
 by
by
