 by
by
Last year, I've blogged about setting up Jenkins with the then just released .Net Core ecosystem. This is an updated post to target the latest dotnet CLI and MSBuild-based csproj format that was introduced with Visual Studio 2017.
This post shows you how to use Jenkins as your Continuous Integration system, a project that supports netstandard, .Net Core or the full .Net Framework, xUnit as test runner and OpenCover to generate the coverage reports. Jenkins will also report any compiler warnings and open tasks you may have in your project (such as // TODO comments). You will need a Windows environment on your CI server, otherwise check here for instructions on Linux.
Required Tools
Obviously, you have to install the .NET Core SDK. It is available at the official dot.net site and installs the dotnet CLI tool and registers it globally for all users on the PATH variable. If you intend to run tests for the full .Net Framework, you have to install the right SDKs for that. I found just installing Visual Studio 2017 with all the .Net SDKs quite simple for that.
In Jenkins, four plugins are required:
- xUnit Plugin to evaluate test results
- Cobertura Plugin for the code coverage data
- Warnings Plug-in to scan for compiler warnings
- Task Scanner Plugin to scan for open tasks
Since we're using OpenCover, the code coverage results must be transformed to the Cobertura format before they're published in Jenkins. The OpenCoverToCoberturaConverter NuGet package should be included as a build-time dependency (<PrivateAssets>All</PrivateAssets>) in your test project. OpenCover works both for .Net Core as well as the full .Net Framework. It's slowing the process quite a bit down, though, so consider splitting larger projects into unit test jobs with code coverage and plain integration or acceptance test jobs without OpenCover.
You TestProject.csproj should look like this:
The xunit, xunit.runner.visualstudio and Microsoft.NET.Tests.Sdk packages are required for xUnit, while the dotnet-xunit CLI tool allows us to run tests directly with dotnet xunit and supply xUnit parameters instead of going through dotnet test. OpenCover and OpenCoverToCoberturaConverter are build time dependencies, both are included in the project. During package restore, the tools are copied to your local .nuget folder. The TargetFrameworks are set to whatever frameworks you want to test. I suggest to always test .Net Core and the full .Net Framework if your project targets netstandard, since sometimes there are slight differences that may crop up by testing against multiple supported platforms. For example, the System.Text.Encoding package behaves different between these two.
Configure your Project under Test
To allow OpenCover to record coverage, it needs to have access to the actual source code. This is easiest done by configuring your project under test to output debug symbols (pdb files) when compiling for debug. This is only required in your actual project, not in your test projects. If your Code Lens support in Visual Studio seems broken and you can't navigate to test cases from the Test Explorer, you might accidentally generate symbols for your test projects, too. This currently messes with xUnit / the Visual Studio test discovery engine and inhibits Code Lens support and mapping from reported test cases to actual code. Configure your project under test like this:
At the root of your project, you need a PowerShell script to run your tests. I like the script approach, since it gives me a reproducible, single-click way (#2 on the Joel Test) to test my project.
Tip: Here's a simpler script if you only want to run tests and no code coverage.
It's doing three things:
- Locate the OpenCover tools via the NuGet cache
- Run xUnit tests with attached OpenCover
- Convert OpenCover results to Cobertura for later processing
Configure the Job in Jenkins
In Jenkins, there's only one simple Execute Windows Batch Command step required:
powershell.exe -NoProfile -ExecutionPolicy Bypass ./TestsAndCoverage.ps1
After the nuget packages have been restored, the dotnet xunit command is available and your tests can run. Every configured test project is tested against all targeted frameworks while the coverage is being recorded. It's not strictly necessary with this script, but it's good advice to configure a job to clean the workspace before each checkout whenever results are written to disk, to be sure no previous runs contaminate your results.
Evaluate Results in Jenkins
In total, four post build actions are required to evaluate all results in Jenkins. Add and configure the tasks as shown below for a great CI experience.
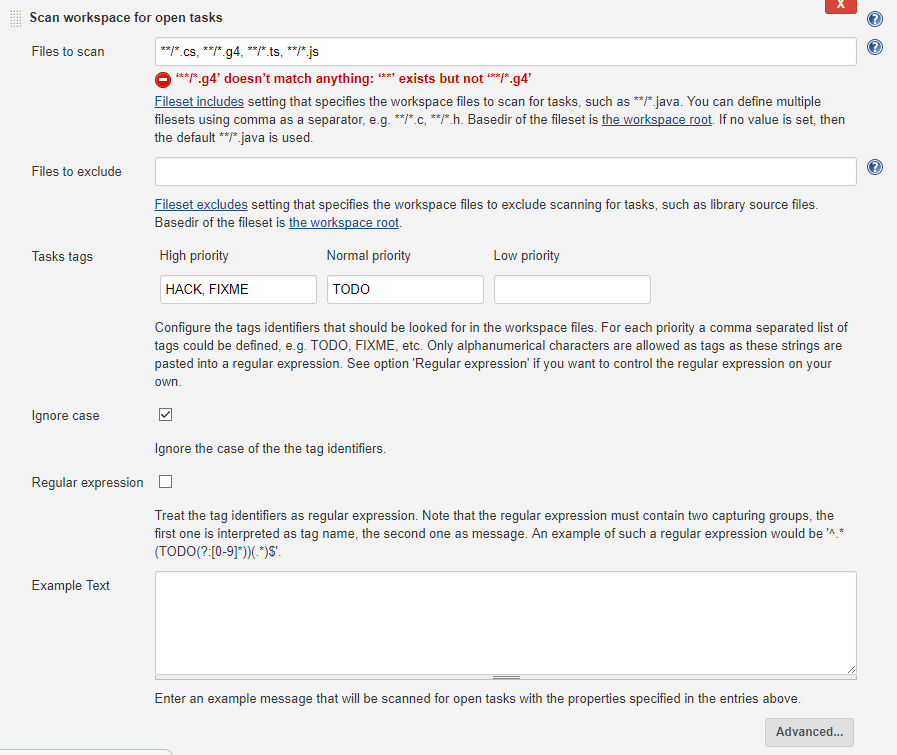
Scan Workspace for Open Tasks
This is great for finding all those // TODO and // HACK things that accumulate in every project. It is part of measuring technical debt and allows you to visually track when you should commit to your backlog and chose refactoring over new features. Or, at least, it gives you a bad feeling when the graph rises...
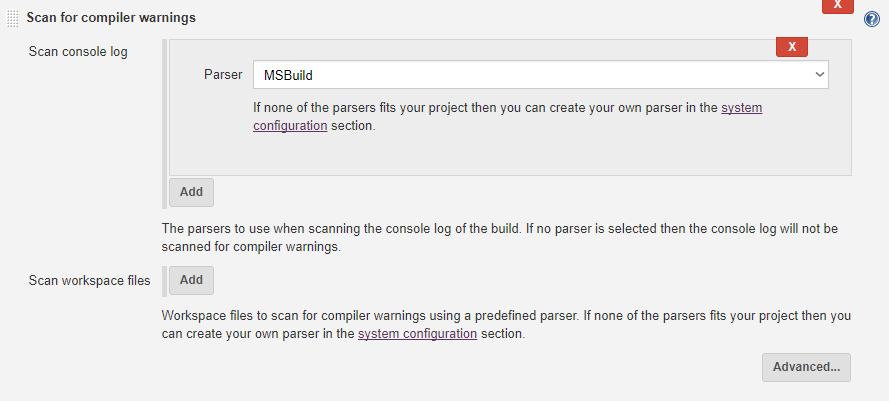
Scan for Compiler Warnings
Similar to Open Tasks, but usually more severe. This task captures all warnings reported during the dotnet build (or MSBuild) process. I'm a big fan of a zero-warnings tolerance, and this report certainly shows you when it's out of hand. In my experience, a lot of compiler warnings directly translate to a lot of bugs and runtime errors, so treat these seriously.
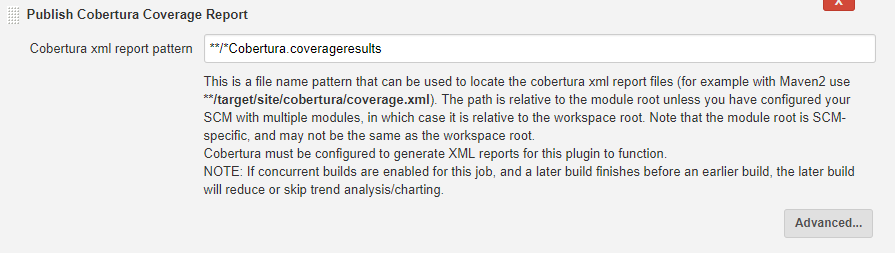
Publish Cobertura Coverage Report
The PowerShell script generates these *.coverageresults files in the workspace directory, you just need to pick them up. But be wary of too strict metrics on code coverage, as I've often seen goals of having a certain percentage of coverage required. In my experience, the most important thing is to have a solid base from where you start and to not have the coverage decline when the code base grows. This makes sure that your changes and additions are properly covered by tests, but you don't have to waste your time writing tests just to have every conditional hit.
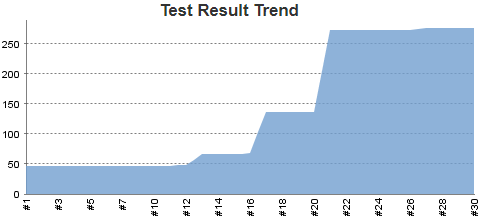
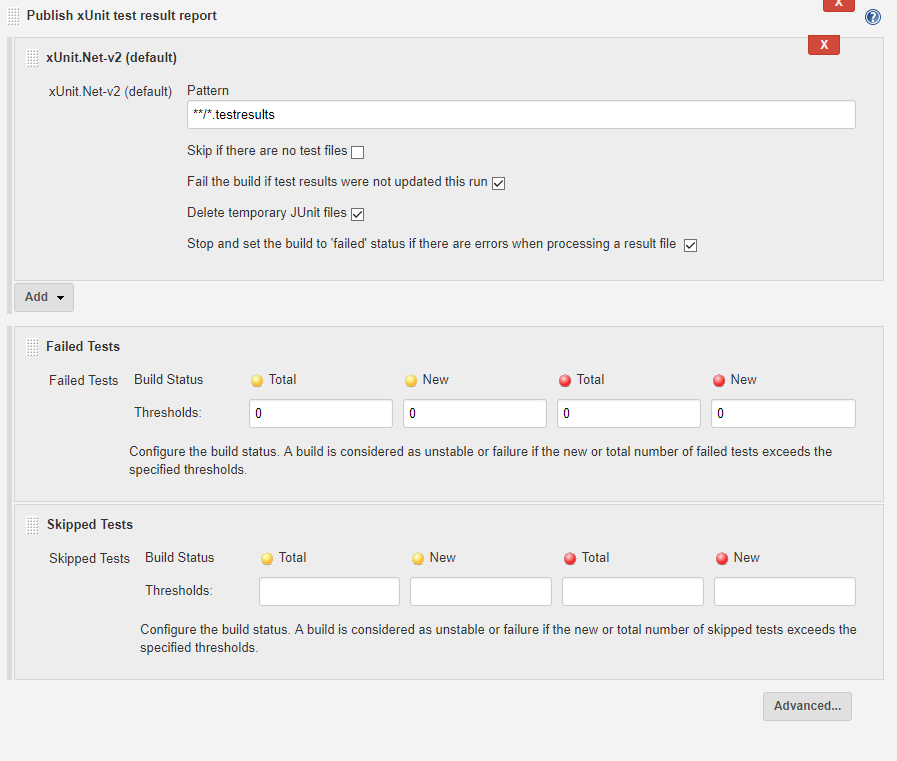
Publish xUnit Test Result Report
Probably the most important task, checking if the code actually does what it's supposed to do. You can configure custom thresholds for when a build is considered a failure, but I can't imagine a case where more than zero would be an acceptable answer here.
Don't forget to add an E-mail notification action at the end, being informed in detail and on time is the most important aspect of CI!
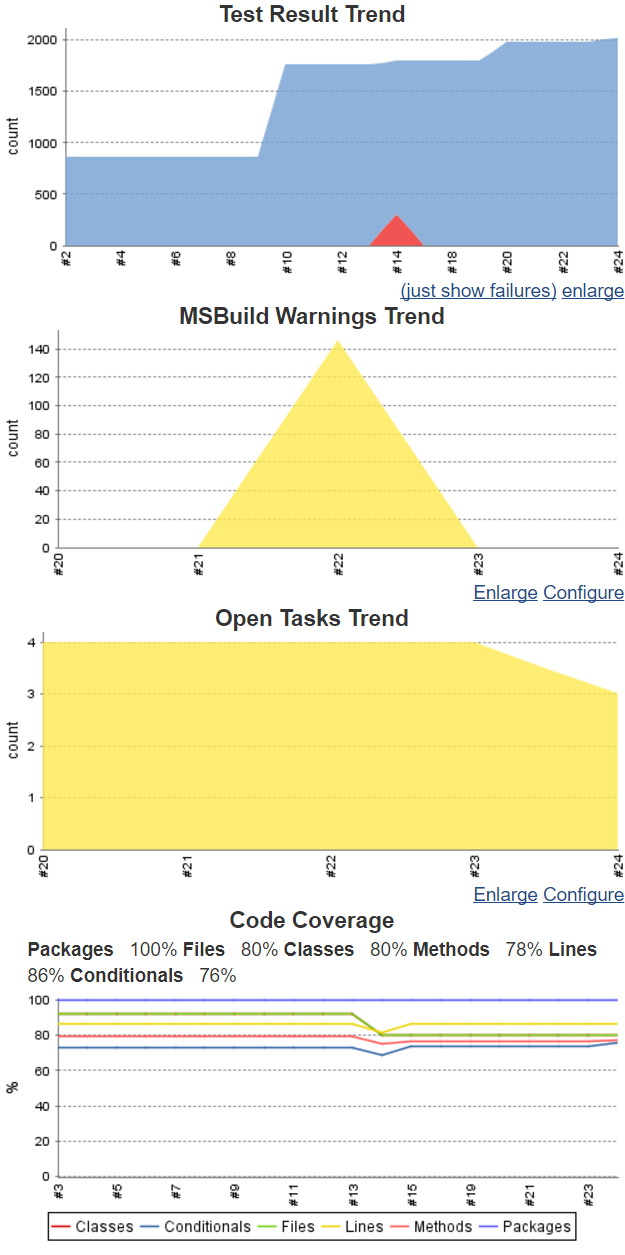
View the Results in Jenkins
Your job view in Jenkins will now display four graphs on the right side for a quick visual overview of your project's health, with more information being available via the menu options. This configuration has been working good for me for all project's I've encountered, and if you want, you can even easily integrate your front end JavaScript (or TypeScript) tests into your job if what you're building is a web project.
Happy Testing!